
Appearance
Dashboard
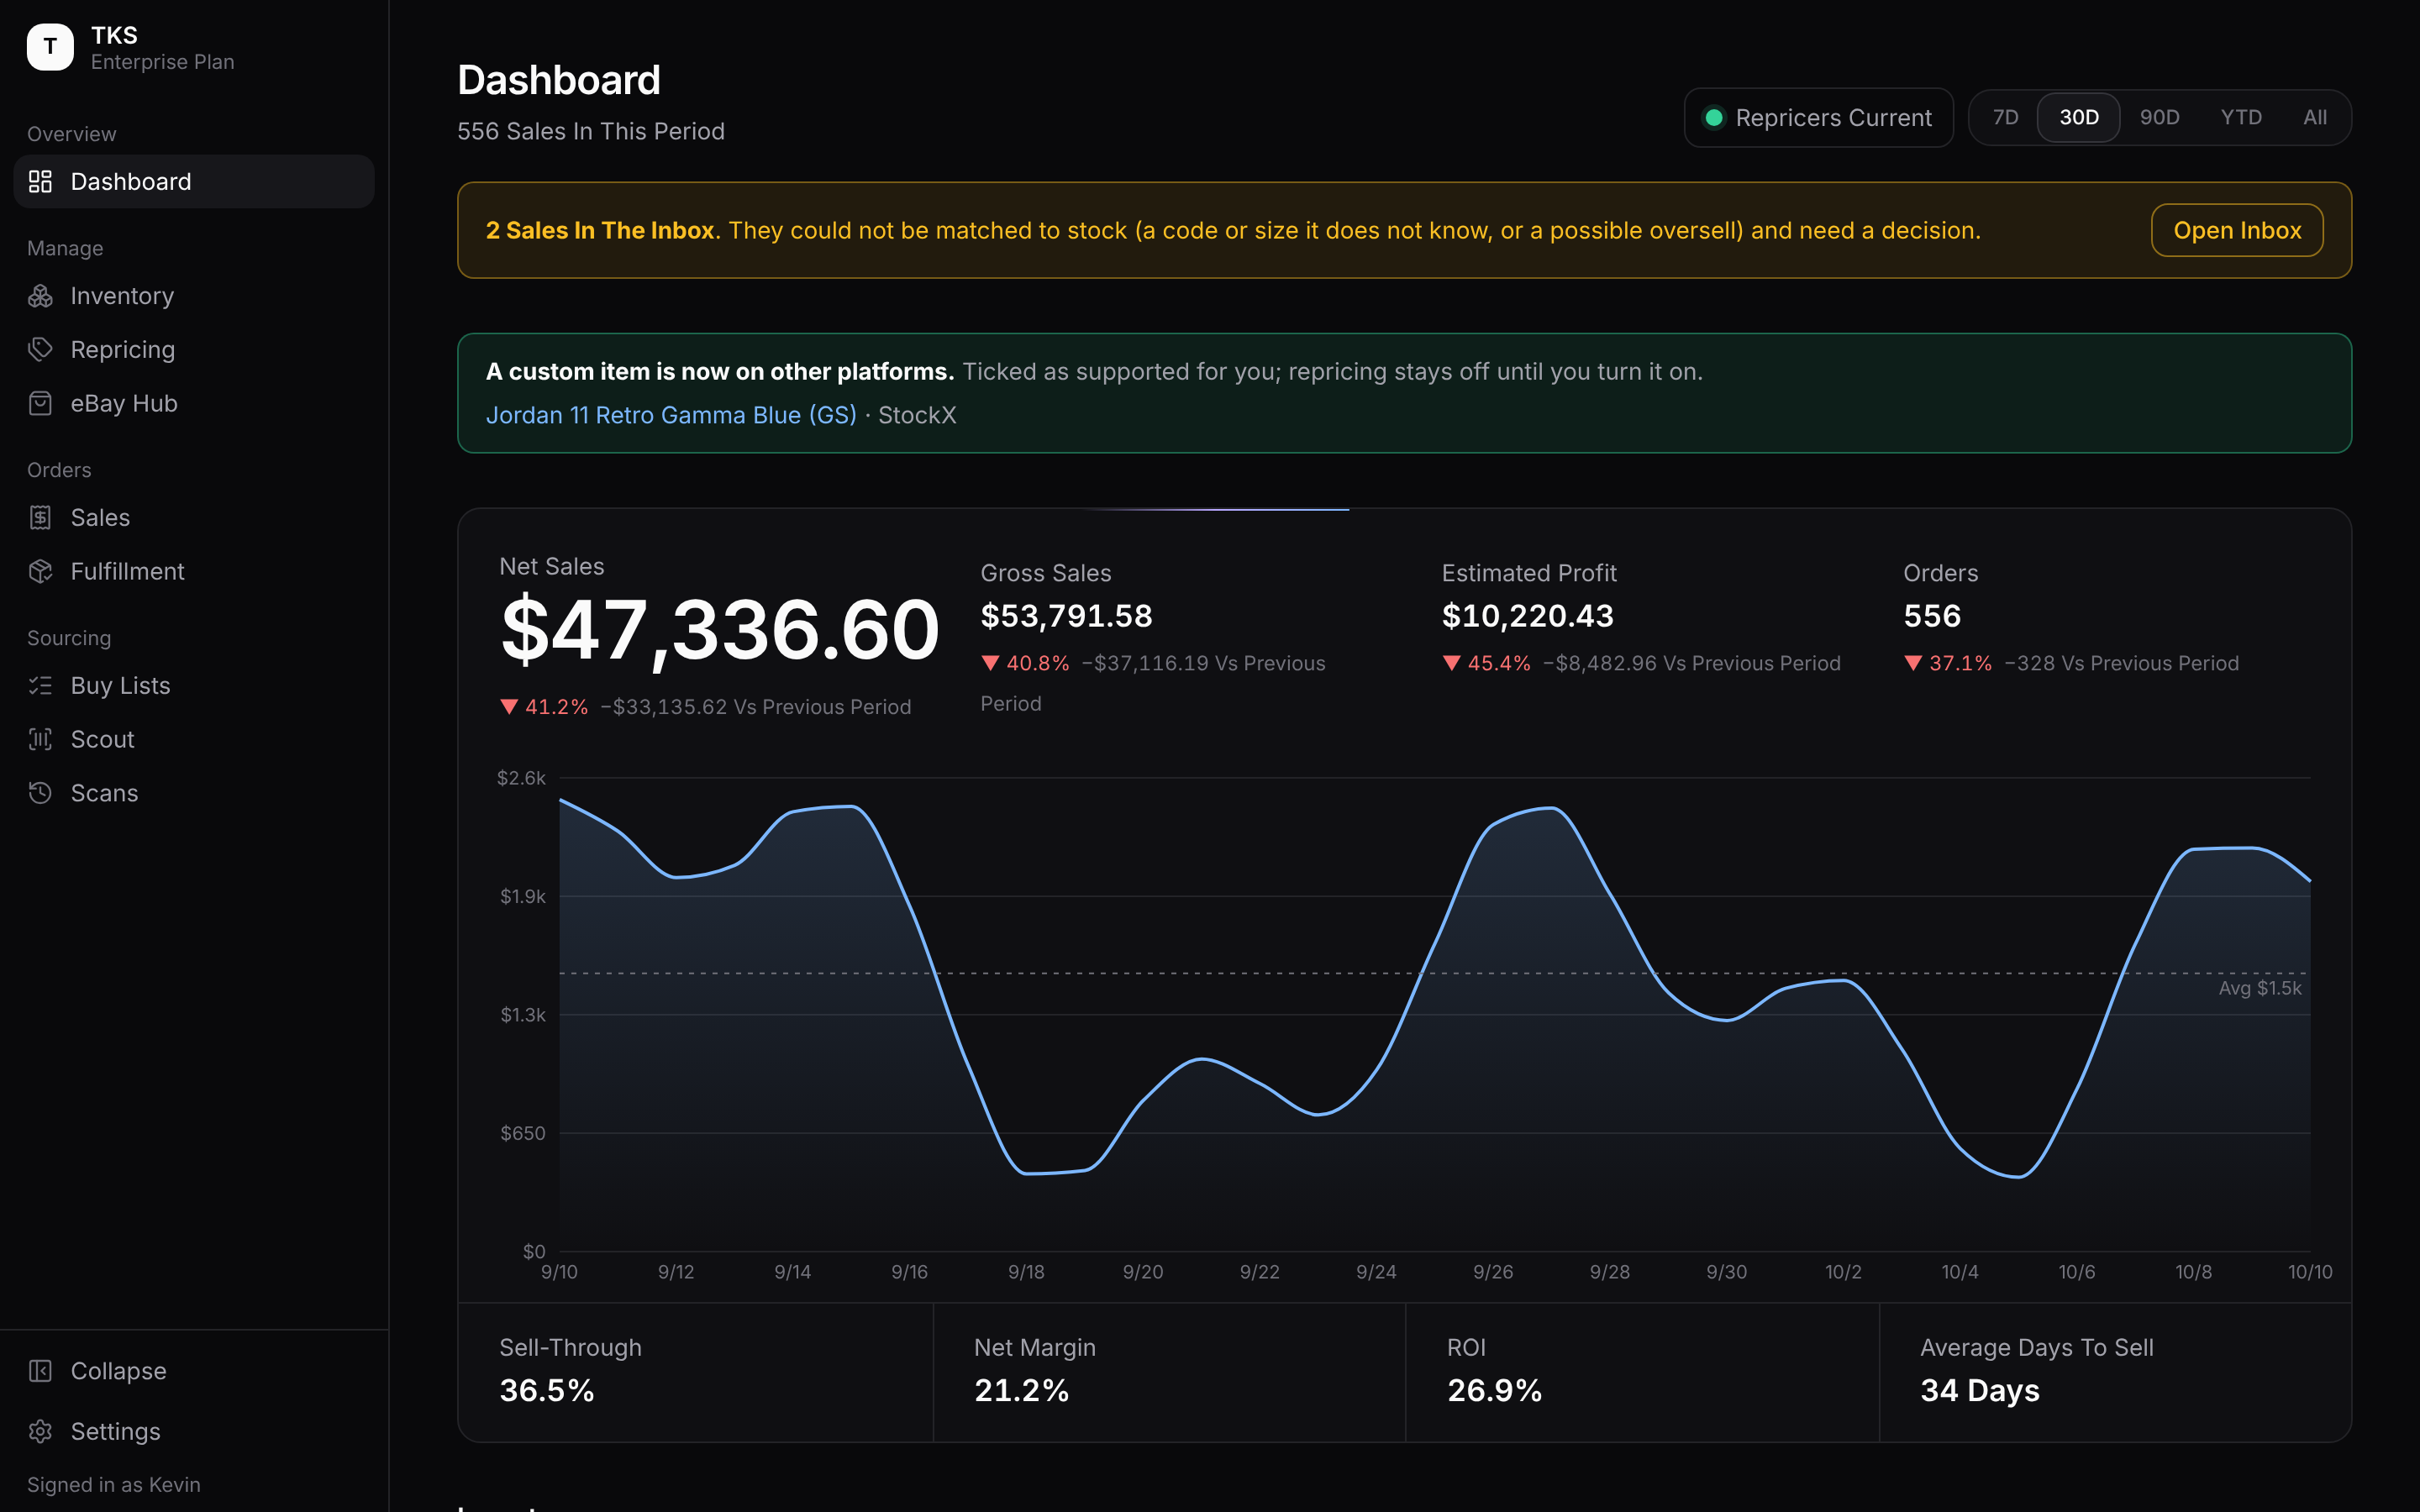
The Dashboard is the first screen after you sign in. It shows how sales are going, what you're holding, and a short list of stock that needs a decision.
Choosing The Period
The buttons at the top right set the period every sales figure covers: 7D, 30D, 90D, YTD (since January 1) or All. Under the title, the Dashboard says how many sales fall in that period.
Your choice is remembered on that device, so the Dashboard opens on the same period next time.
Repricer Status Admins
Next to the period buttons, a coloured dot shows whether your repricers are keeping up:
| Dot | Says | Means |
|---|---|---|
| 🟢 Green | Repricers Current | Every repricer has run recently. |
| 🟡 Amber | Repricers Behind | A repricer has missed a run (nothing for 5 hours or more). |
| 🔴 Red | Repricers Stopped | A repricer hasn't run for 12 hours or more, its last run failed, or it has never run. |
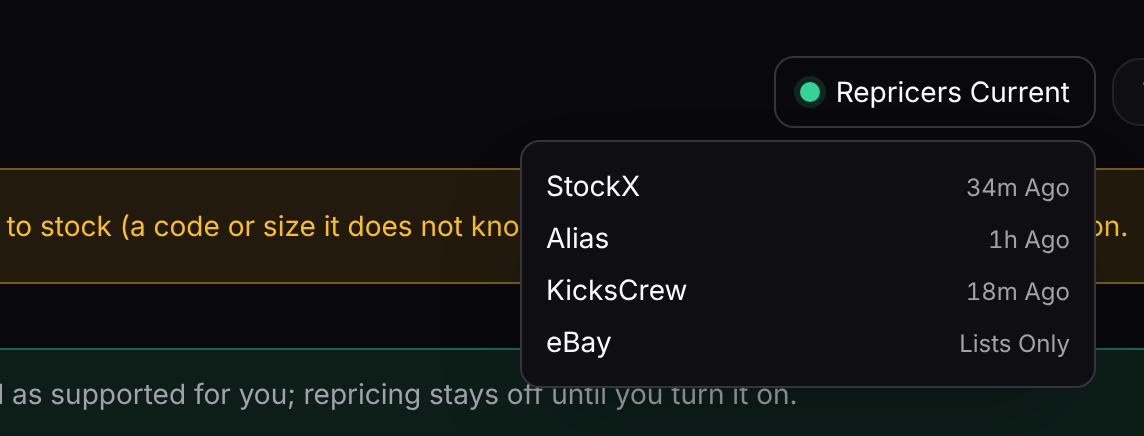
Click the dot to see when each marketplace was last repriced. eBay shows Lists Only, because TKS lists on eBay but doesn't reprice there. Not Run Yet means that marketplace hasn't been repriced since it was connected. A failed run says what went wrong underneath.
The dot only appears on plans that include repricing.
Banners At The Top
When something needs your attention, a banner appears above the numbers. When nothing does, there are none.

- Vacation Mode Is On (amber)
- Your listings are paused or parked while you're away. It says since when. Turn Off ends vacation mode straight away, and What It Is Doing opens Settings to show what it changed on each marketplace.
- Finish Setting Up Admins
- Shown until setup is finished. It shows how many steps are done and which is next. Continue Setup picks up where you left off. See Getting Started.
- Sales Not Picked Up (red) Admins
- New sales normally get matched to the pair that sold within a minute. This banner means some have waited longer, and says how long the oldest has waited. Nothing is lost: they're matched as soon as matching runs again.
- Sales In The Inbox (amber) Admins
- Sales TKS looked at but couldn't match to your stock. Usually the code or size is one TKS doesn't know, or the sale would take a size below zero (a possible oversell). Open Inbox takes you to them in the Sales tab, where you decide what each one was.
- A Custom Item Is Now On Other Platforms (green) Admins
- A custom item you created is now carried by another marketplace, so TKS has ticked that marketplace for it. Repricing stays off for it there until you turn it on. Click an item to open it in Inventory.
Sales
- Net Sales
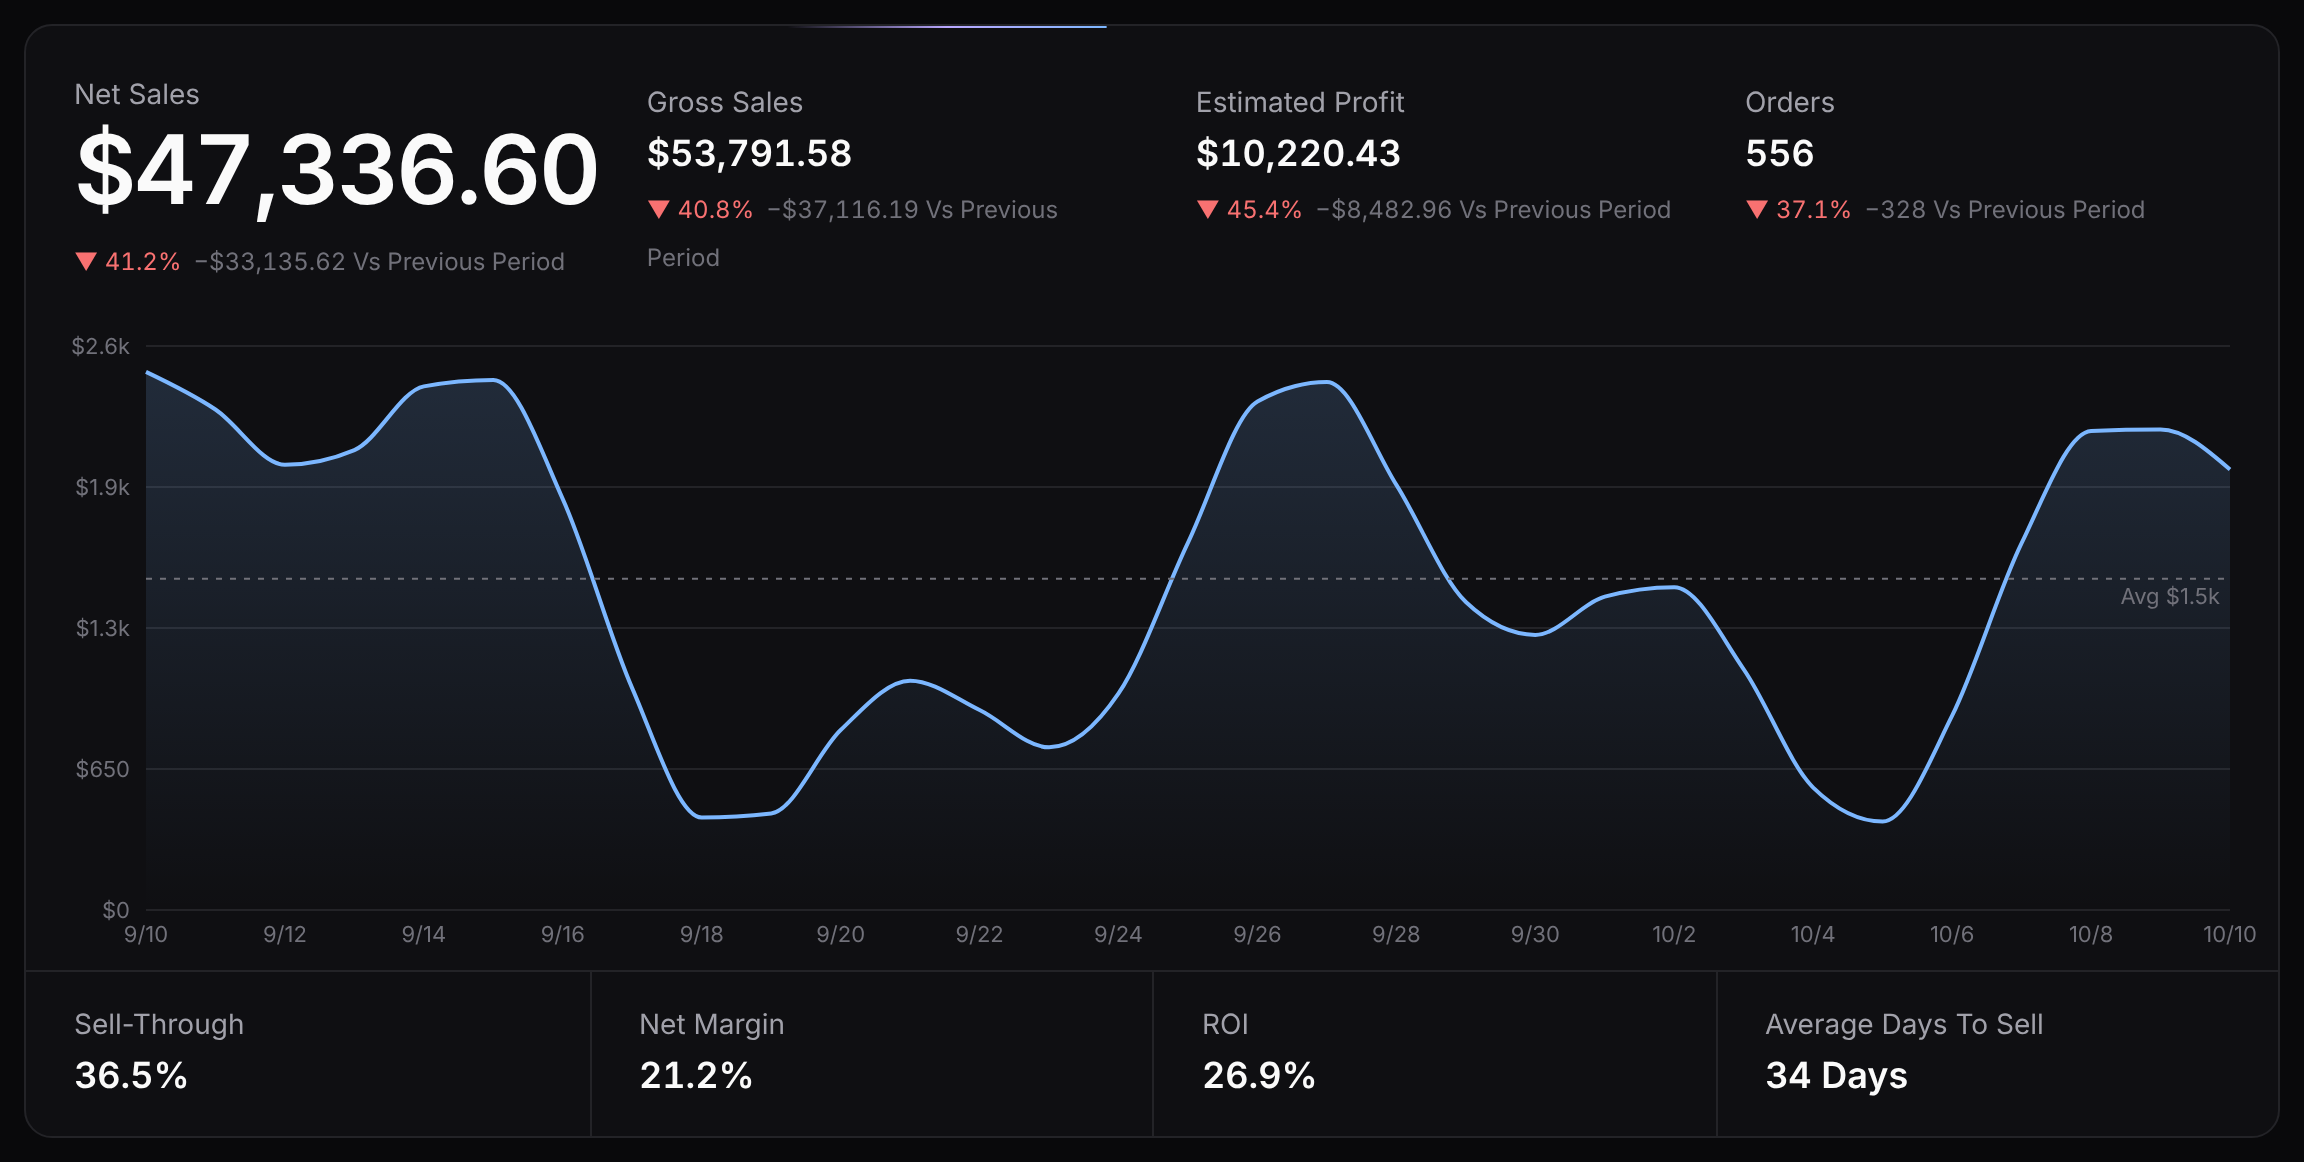
- What the marketplaces paid you in the period, after their fees. This is the big number.
- Gross Sales
- What buyers paid, before marketplace fees.
- Estimated Profit
- Net sales minus what those pairs cost you. It's estimated because a sale whose pair has no cost recorded counts as no cost, so profit reads high until costs are filled in.
- Orders
- How many sales.
Under each figure, the arrow compares it with the period of the same length just before (for 30D, the 30 days before that). Green ▲ is up, red ▼ is down. No Earlier Period means there's nothing to compare with yet.
The chart shows net sales day by day. The dotted line is the daily average for the period. Point at a day to see its net sales, number of sales and profit.
Along the bottom:
- Sell-Through
- Sales in the period ÷ (those sales + the pairs you hold now). It's the share of your stock that's moving. Higher means your stock is turning over faster.
- Net Margin
- Estimated profit ÷ net sales: how much of every dollar you're paid you keep.
- ROI
- Estimated profit ÷ the cost of the pairs that sold: what you made back on what you spent.
- Average Days To Sell
- For the pairs that sold in the period, the average number of days from when you bought them to when they sold. Pairs without a purchase date are left out.
Inventory

These always show what you hold right now, whatever period is chosen.
- On Hand
- Every pair on your shelf, and how many different products they are.
- Inventory Cost
- What everything on hand cost you, and the average per pair.
- Listed Repricing Plans
- Pairs with a live listing on at least one marketplace.
- Not Listed Repricing Plans
- Pairs with no live listing anywhere, and what share of your stock that is. It turns amber when it's above zero.
Where Sales Come From, And Where Stock Is Listed
- Sales By Marketplace
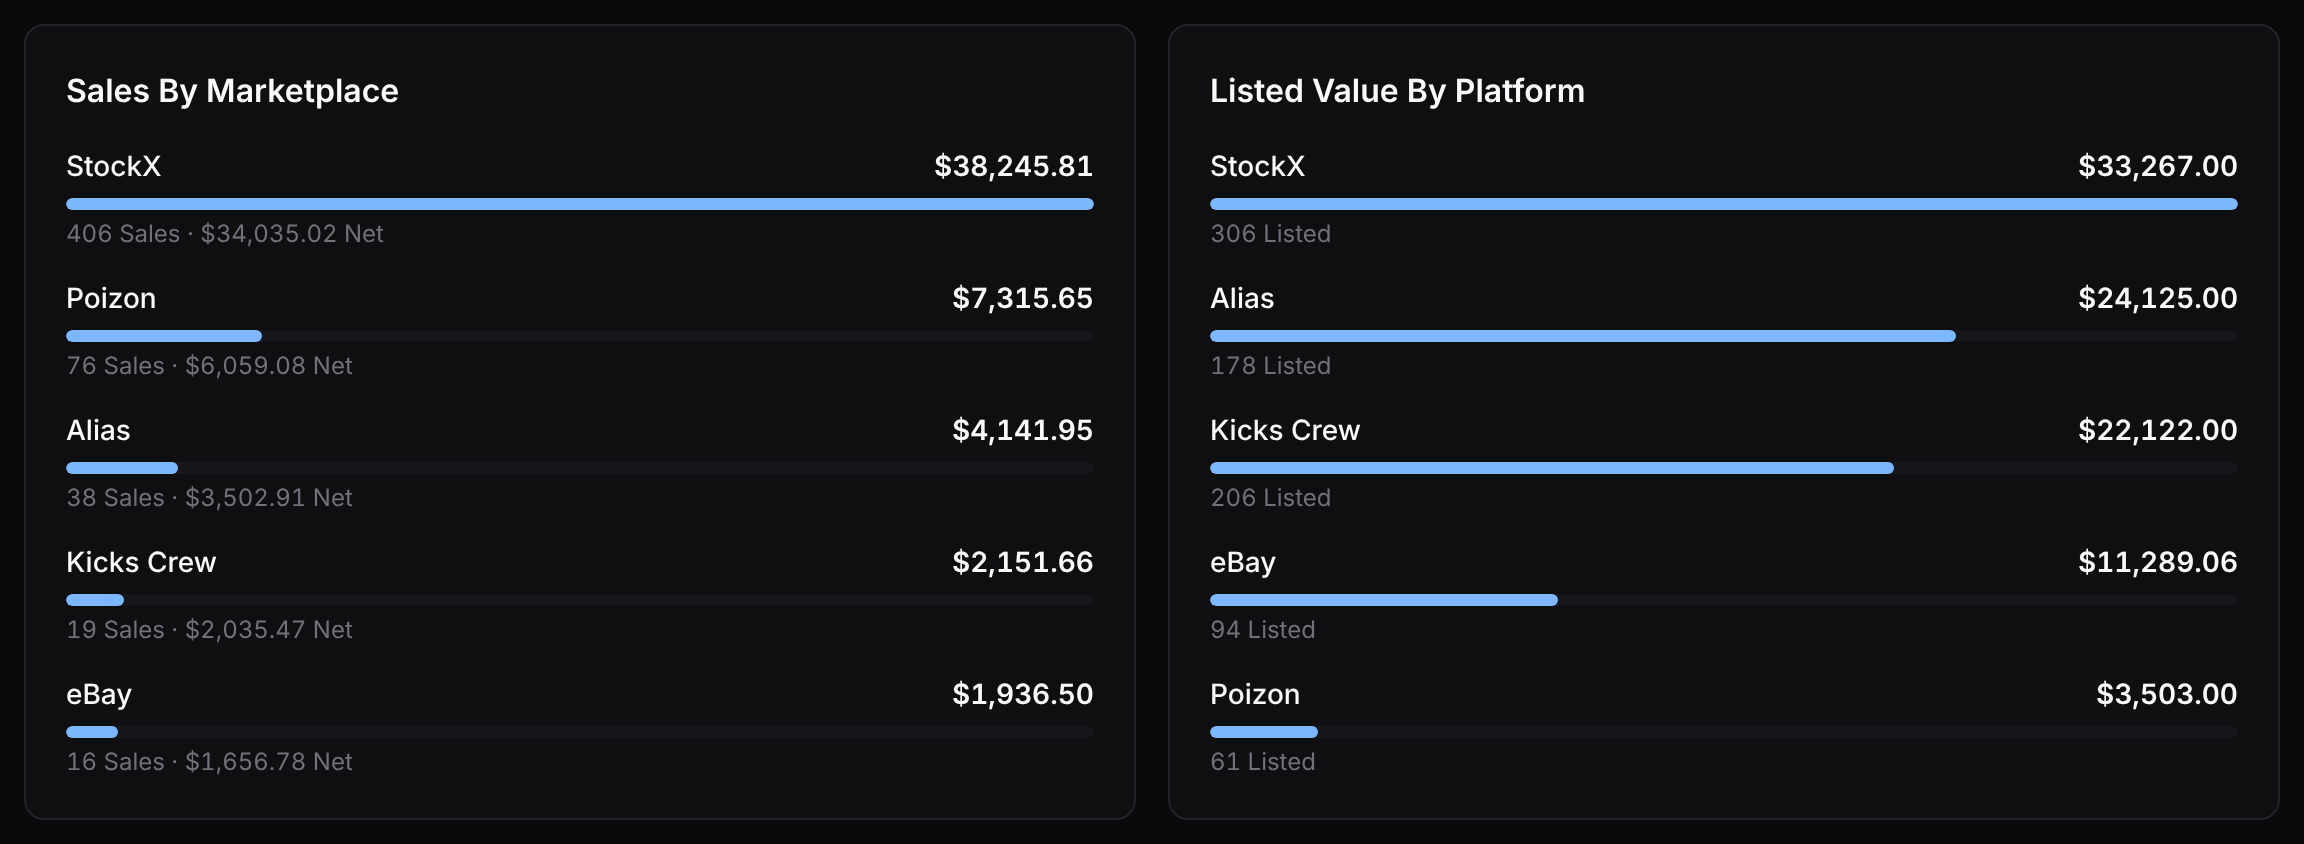
- Gross sales per marketplace in the period, largest first. Under each: the number of sales and the net you received.
- Listed Value By Platform Repricing Plans
- The total of your live asks on each marketplace right now, and how many listings that is.
Needs A Decision
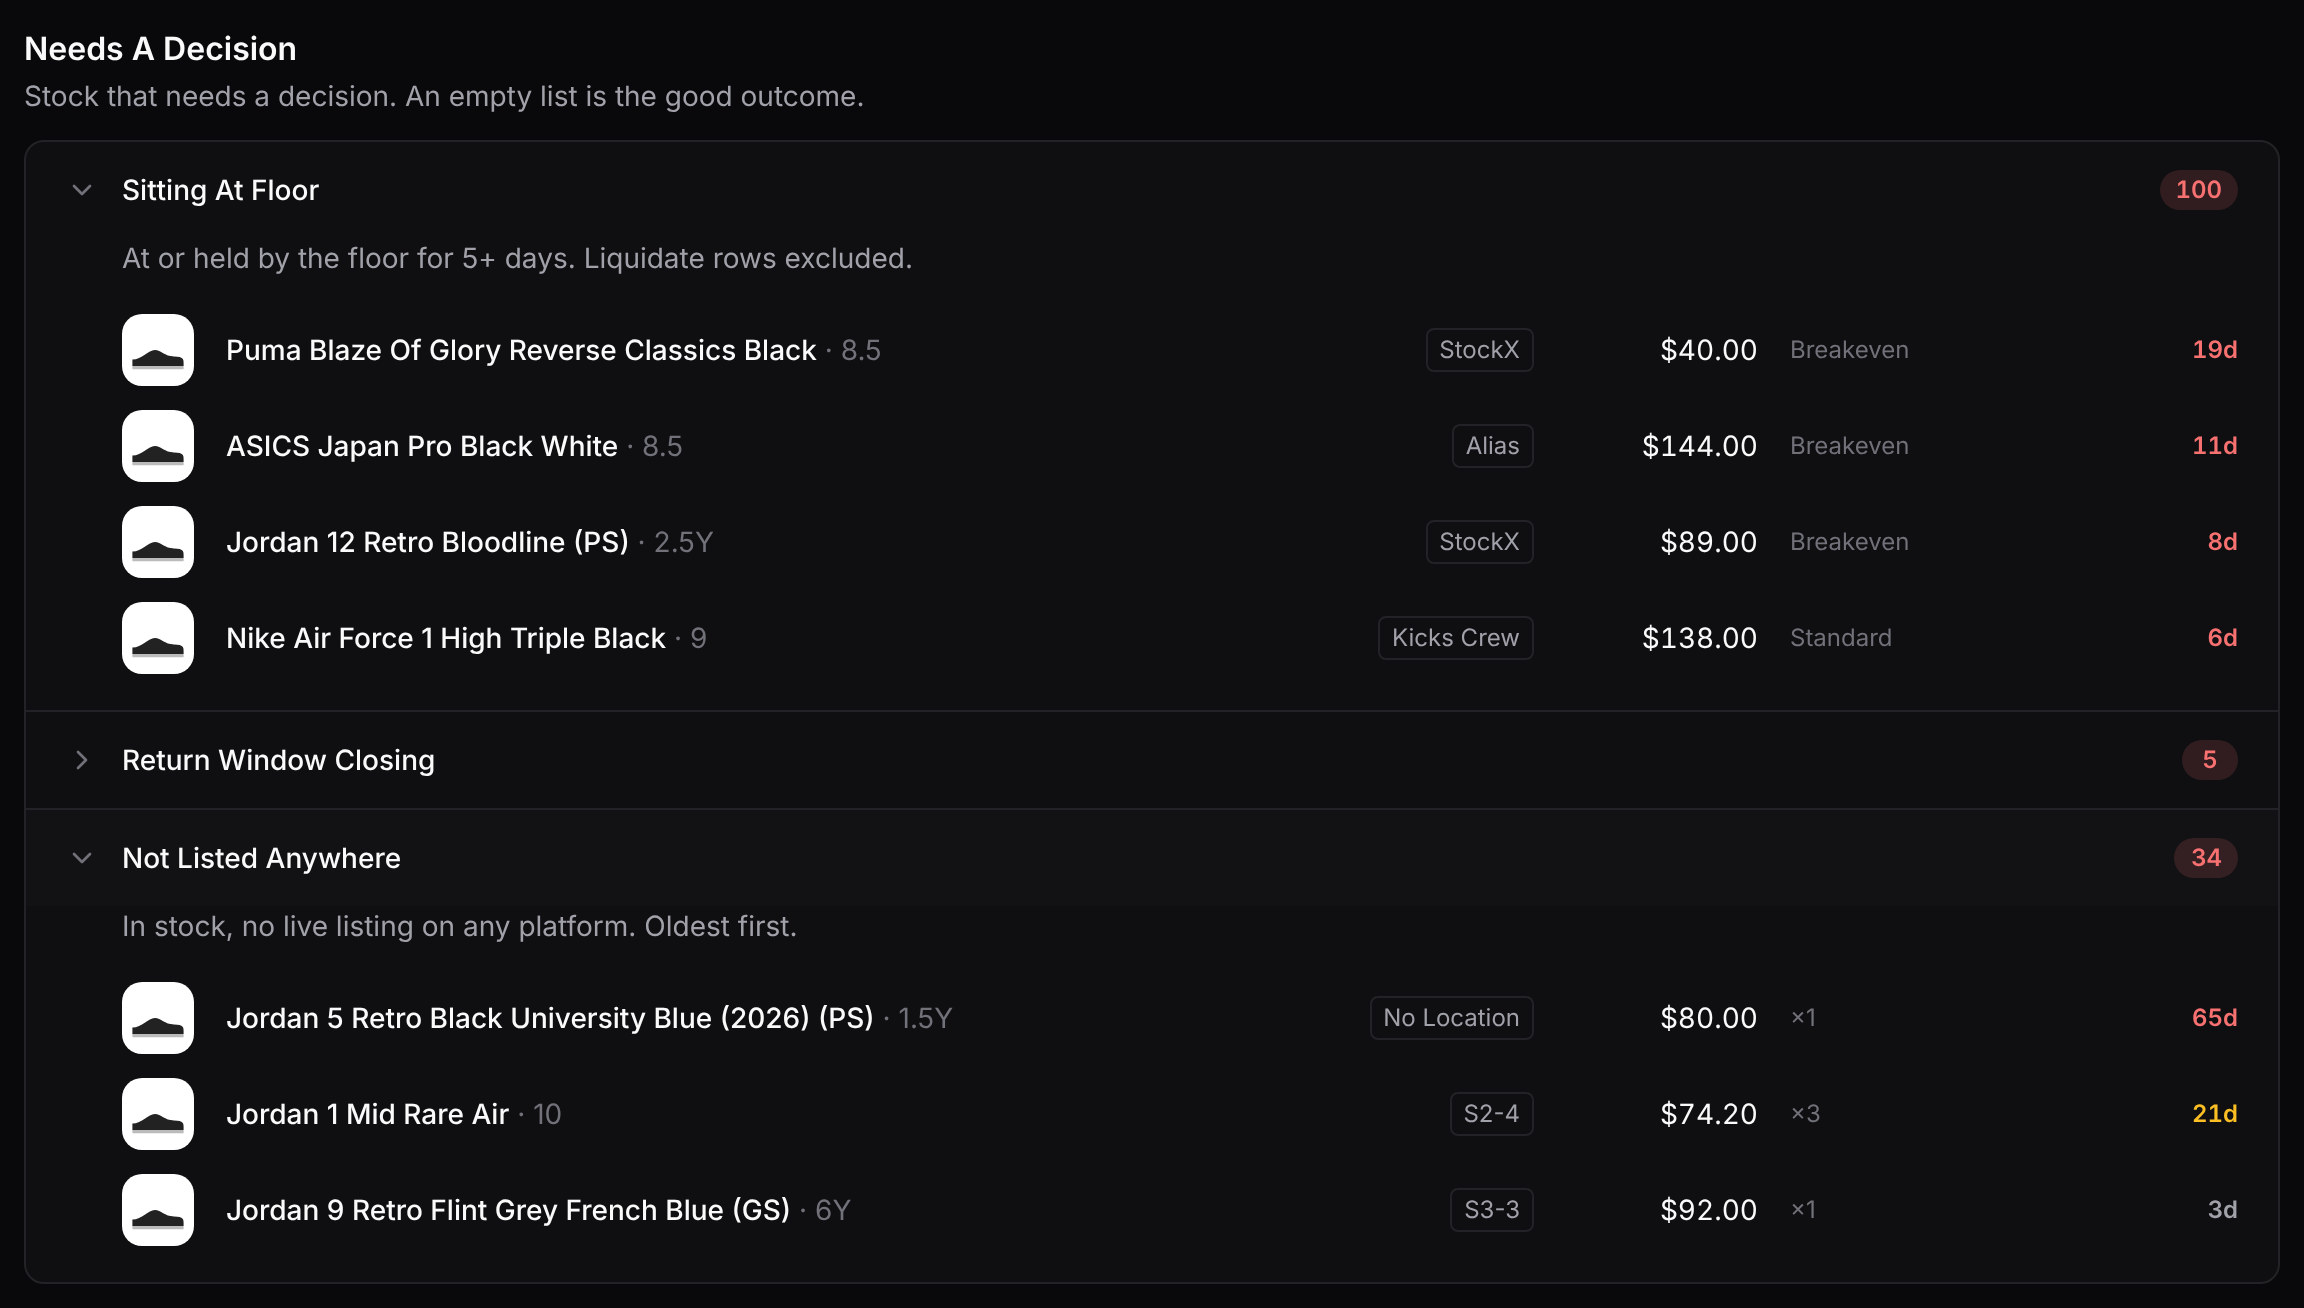
Lists of stock that needs a decision from you. Each one shows its count. Click a list to open it, and click any row to open that size's item page. An empty list is the good outcome.
- Sitting At Floor Repricing Plans
- Sizes that have been at their floor, or held there, for 5 days or more. The market is below what you're willing to sell for, so they aren't selling. Each row shows the marketplace, your price, the floor method and how many days it's been. Sizes on the Liquidate method are left out, because selling low is the point of that method.
- What to do: decide whether to wait, lower the floor (a different floor method on the Repricing tab), or move the pair elsewhere.
- Return Window Closing
- Pairs that aren't selling and are close to their store's return deadline: within two weeks of it, or up to a day past. "Not selling" means the style has never sold in any size, or has sat at its floor for over 5 days. Each row shows the store, how many units are still from that purchase, why it's listed, and the days left (red when 2 or fewer, or when past).
- What to do: return the pair to the store while you still can, or reprice it to sell.
- TKS knows the return window for Nike, SNKRS, adidas, Shoe Palace, Shop Simon (30 days), Finish Line, Scheels (45), JD Sports (28), Foot Locker, Champs and Dick's (90). Purchases from other stores are skipped, and the list says how many.
- Not Listed Anywhere Repricing Plans
- Pairs in stock with no live listing on any marketplace, oldest first. Each row shows the shelf location, cost, units and how long you've had it. The age turns amber at 14 days and red at 60.
- What to do: open it and switch a marketplace on, or check why it came down.
- Not Lowest Ask Plans Without Repricing
- On plans that list but don't reprice, this replaces Sitting At Floor. Once a night, TKS checks your top listings and shows how many aren't the lowest ask, and by how much on average. Each row shows your price, the lowest, and the difference.
Common Questions
Why does Estimated Profit look too high? Sales whose pair has no cost count as pure profit. Fill in missing costs on the Inventory tab and the figure corrects itself.
Why don't I see the repricer status or the sale banners? They're for account admins. If you're a team member, your admin sees them.
The numbers didn't change when I picked a new period. The sales figures dim for a moment while the new period loads. The Inventory figures never change with the period, because they're always what you hold now.